


��ô��excel��ʹ�ú�������cpkֵ?���������excel��ʹ�ú�������cpkֵ�ľ��巽�������������ɡ�
excel�����������cpkֵ�ķ���
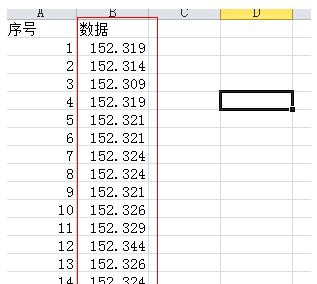
�ռ�������Ҫ���Ƶ����Ե����ݣ��������뵽Excel���У�ע����Ҫ��������
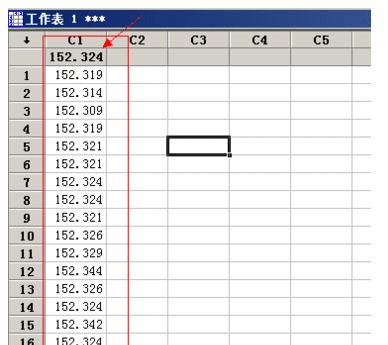
��Minitab��������Excel�е����ݸ���ճ����Minitab�еı�����
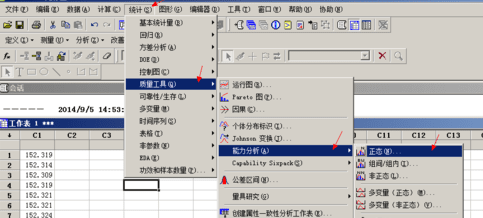
Ȼ�� ͳ��--��������--��������--��̬
Ȼ��ͻᵯ��һ���Ի������һ���ո�Ȼ��˫������г���C1 152.324��������Ͱ��������ݷŵ��˵�һ���ո���---�����ѡ�����ݵĹ��̡�Ȼ�������С����5
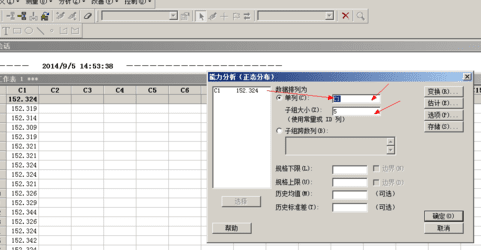
Ȼ�����������������Ҫ��Ĺ�����������
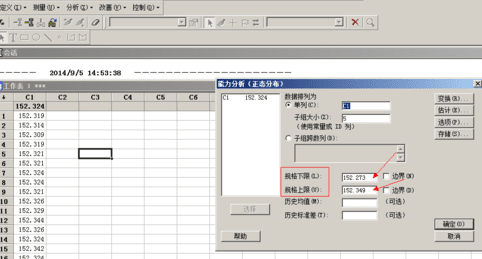
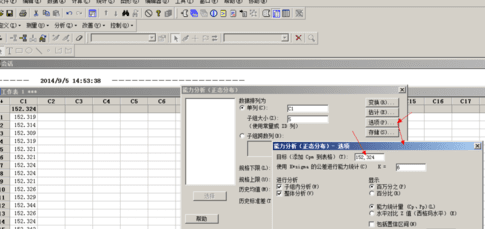
�ȱ�æ�ŵ��ȷ������� ���Ͻ��и� ѡ�� ��ť���ᵯ����һ���Ի������������ͼ�������ģ�Ŀ�� ����������Ե�����ֵ�������6��Ĭ�ϵģ���������6Sigma������ͼ������Ҳ���Ըij�5��4����
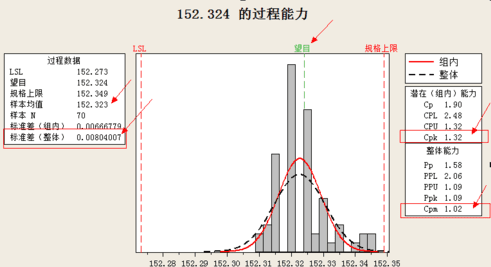
���������ε��ȷ���������͵õ���CPKͼ�����еĿ���ָ��һĿ��Ȼ��CPK PPM ���� CPM���O��
���Ͼ�����excel��ʹ�ú�������cpkֵ�ľ��巽���ˣ���Ҷ�ѧ������?


