

你们知道excel2007如何设置图表颜色吗?下面就是excel2007设置图表颜色的方法,感兴趣的就一起来学习一下吧。
excel2007设置图表颜色的方法:
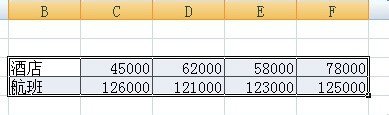
设置图表颜色步骤1:输入相关的数据。
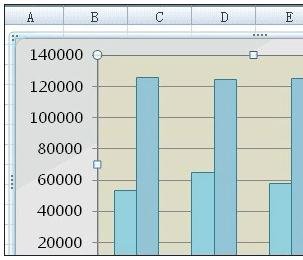
设置图表颜色步骤2:按“插入”选项,在“图表”选项中选择“柱形图”。

设置图表颜色步骤3:选择一种 最普通的二维柱形图。
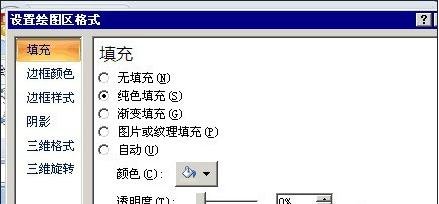
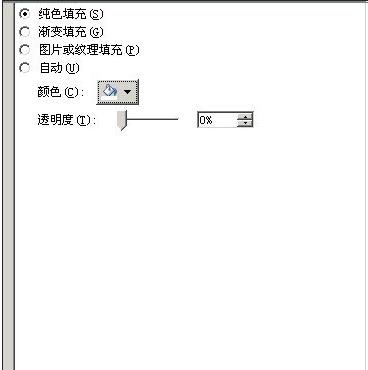
设置图表颜色步骤4:单击设置所选内容格式按钮。

设置图表颜色步骤5:从“颜色”下拉列表中,“主题颜色”部分选择“白色”。
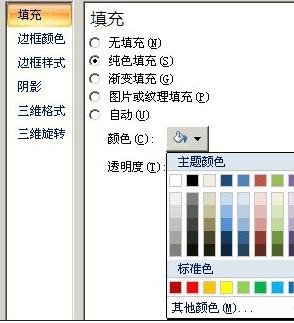
设置图表颜色步骤6:单击“关闭”。
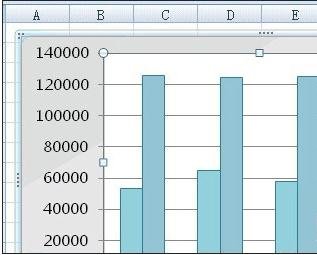
设置图表颜色步骤7:这时可以看到,图表绘图区的颜色已经更改成白色了。
以上就是excel2007设置图表颜色的方法,希望可以帮助到大家。


")
")


语音转文字!新媒体翻译者都有哪些实时语音转文本工具?")


