

如何在excel2016中使用函数统计区间数字?相信对于刚接触excel的小伙伴来说还有一定的难度,下面感兴趣的小伙伴就和小编一起来学习一下Excel中用函数统计区间数字的方法吧!
excel2016用函数统计区间数字的方法
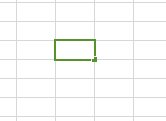
统计区间内数量步骤1:打开你所要统计的数据库表格,在空白地方,或者选中你需要输入数据的那个空。
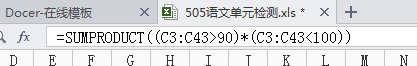
统计区间内数量步骤2:在空中输入这样一个函数,你可以直接复制过去,或者在常用函数中寻找,最简单的还是复制吧。
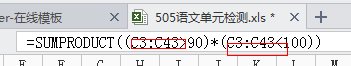
统计区间内数量步骤3:其中框出来的表示你所统计的数据,在这些数据中找。框出来可以手动修改,也可以直接鼠标拖动,选中你需要统计的数据,不难发现前后要一致。
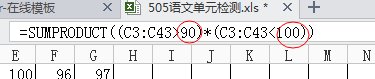
统计区间内数量步骤4:圈出来的表示你需要统计的区间,修改好之后,回车即可。
有关函数查找的教程阅读:
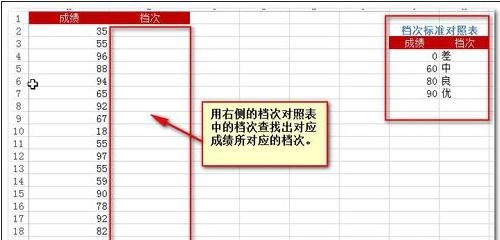
函数查找步骤1:我们有如下一组数据,和一档对照表。
函数查找步骤2:我们的目标是将左侧的成绩,按照右侧的对照表进行档次归类。
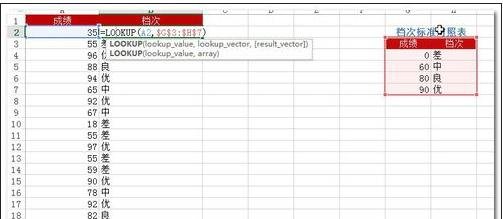
函数查找步骤3:如图,对对应单元格中输入公式(使用LookUP函数):
=LOOKUP(A2,$G$3:$H$7)
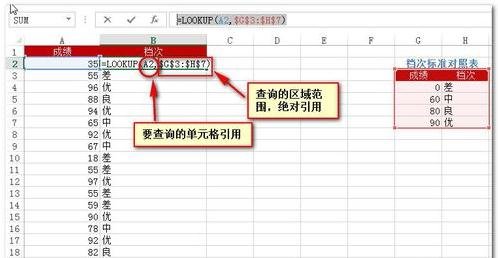
函数查找步骤4:公式中的相应注释如图所示:
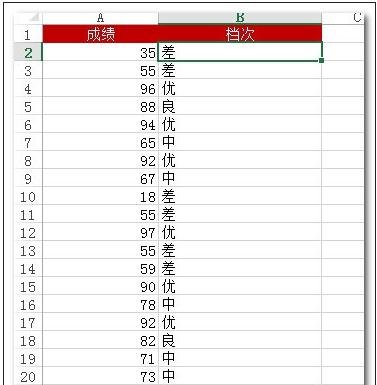
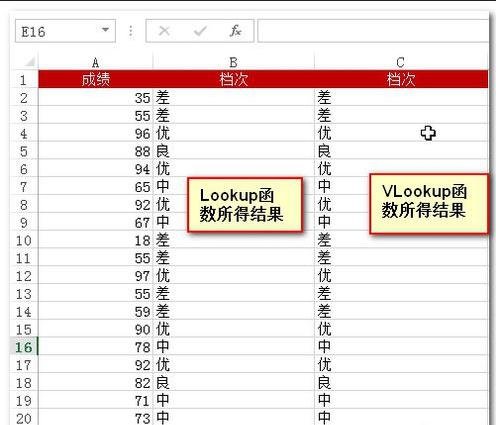
函数查找步骤5:自动填充后的效果如图所示:
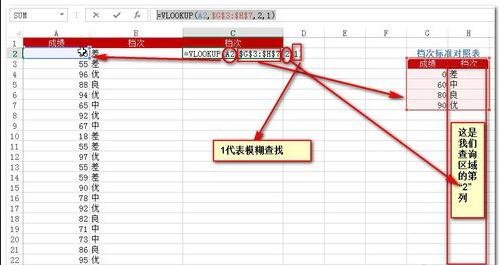
函数查找步骤6:同样的,我们可以使用VLookup函数,输入公式:
=VLOOKUP(A2,$G$3:$H$7,2,1)
公式释义如图:
函数查找步骤7:确定后所得结果如图所示,与Lookup函数所得结果完全一样。
以上就是如何在excel2016中使用函数统计区间数字的全部内容了,大家都学会了吗?


")
")


语音转文字!新媒体翻译者都有哪些实时语音转文本工具?")


