

如何在excel2016中画象限图?相信对于刚接触excel的小伙伴来说还有一定的难度,下面感兴趣的小伙伴就和小编一起来学习一下在excel2016中画象限图的方法吧!
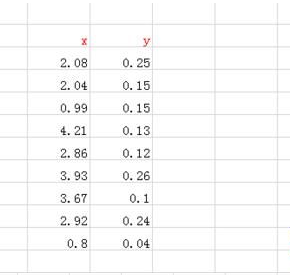
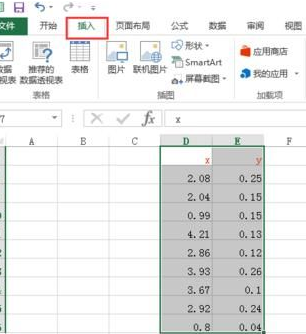
1、选中要用的两组数据,点击菜单栏插入,如图一
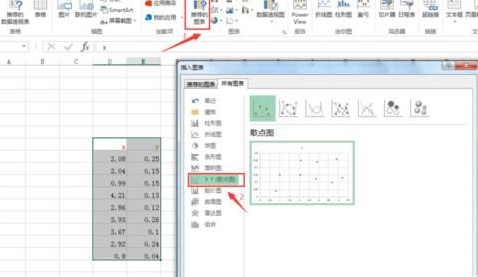
2、点击推荐的图表,选择散点图,点击确定,操作步骤如图二
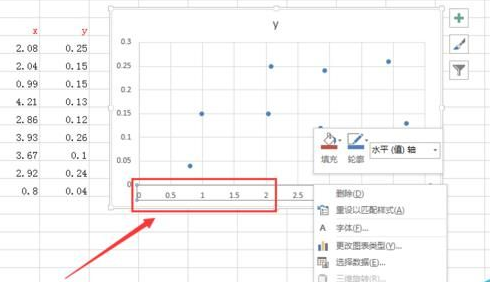
3、右击底部数据栏,选择“设置坐标轴格式”,如图三
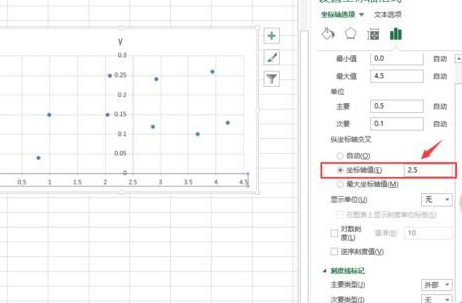
4、设置纵坐标与横坐标交叉点坐标(我这里设置的是2.5),如图四
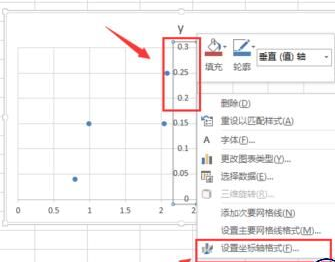
5、右击中间数据栏,选择“设置坐标轴格式”,如图五
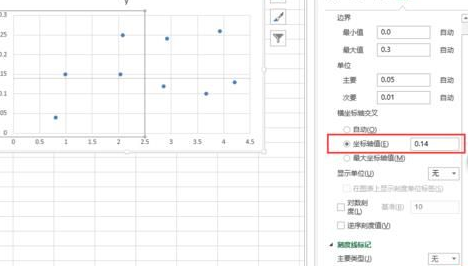
6、设置横坐标与纵坐标交叉点坐标(我这里设置的是0.14),标签位置选择”底部“,如图六
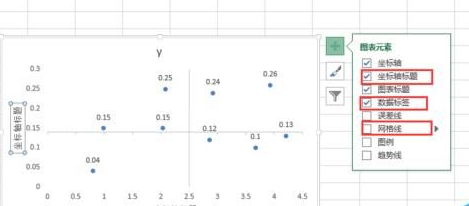
7、点击右边的绿色”加号“,勾选”坐标轴标题“,”数据标签“等所需项目,去掉网格线,如图七
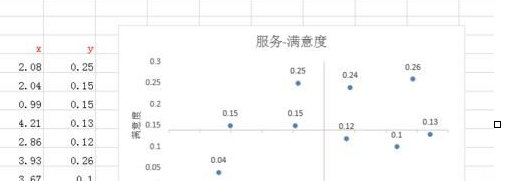
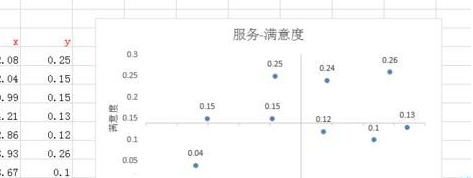
8、点击添加坐标轴标题与图表标题,象限图完成,如图八
以上就是如何在excel2016中画象限图的全部内容了,大家都学会了吗?


")
")


语音转文字!新媒体翻译者都有哪些实时语音转文本工具?")


