

最近一些用户们总会询问PPT如何利用参考线辅助来制作?今日在此篇教程中就呈现了PPT中利用参考线辅助来制作的详细操作步骤。

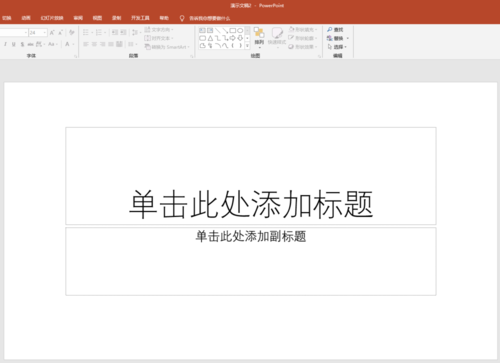
打开PPT,建立空白文档。
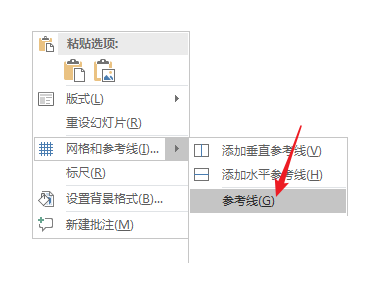
在页面空白区域点击鼠标右键,点击【网格和参考线】―【参考线】。
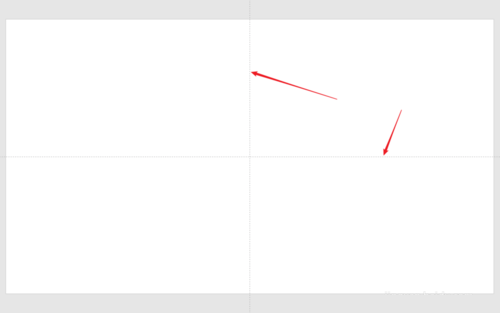
则页面中就出现了默认的参考线,两条参考线将页面进行四等分。
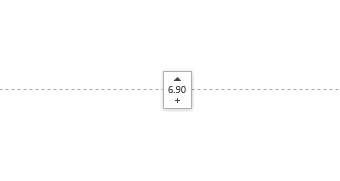
将鼠标移动到参考线上,鼠标变成箭头形状后,按住Ctrl键,并拖动鼠标,就能复制出一条参考线。
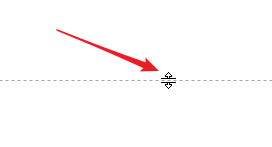
当拖动到合适的位置(也可以根据显示的数值)释放鼠标。
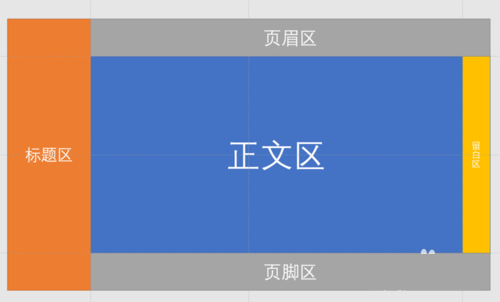
这样,多条参考线就将页面分成了多个区域。

用矩形框出参考线分割成的几个区域,更加直观显示出参考线的存在。这样,在各自区域开展幻灯片内容的制作,就会显得有条不紊。
相信你们看完了上文讲解的PPT中利用参考线辅助来制作的详细操作步骤,你们是不是都学会啦!


")
")


语音转文字!新媒体翻译者都有哪些实时语音转文本工具?")


