

你们知道excel2013如何添加误差线吗?不少小伙伴对误差线都还不太了解吧,那么下面就来看看excel2013添加误差线教程吧。
excel2013添加误差线的使用教程:
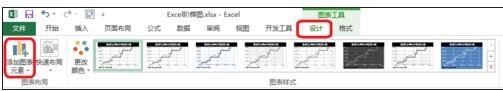
添加误差线的教程1:点击图表工具――设计――添加图表元素。
添加误差线的教2:点击误差线――标准误差――百分比误差――标准偏差――其他误差线选项。

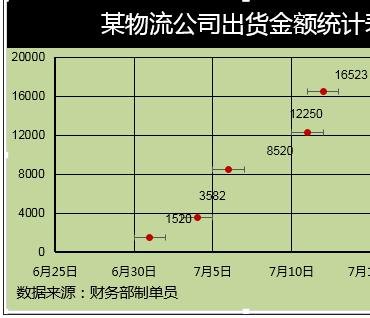
添加误差线的教程3:如图所示点击标准误差。
分为X轴偏差――Y轴偏差。X轴偏差向右。
2.误差线设置
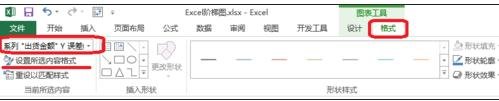
添加误差线的教程1:图表工具――格式――系列出货金额Y误差――设置所选内容格式。
负偏差。
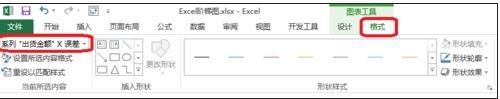
添加误差线的教程2:.图表工具――格式――系列出货金额X误差――设置所选内容格式。
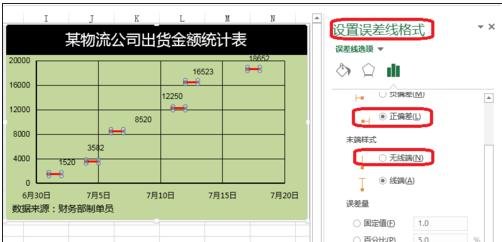
正偏差。
添加误差线的教程3:点击设置误差线格式――通过自定义(指定值)来对误差进行设置。
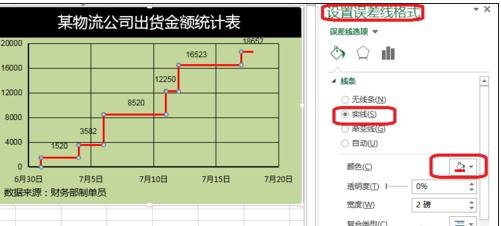
添加误差线的教程4:.点击设置误差线格式――填充,对误差线的颜色等进行设置。
以上就是excel2013添加误差线教程,希望可以帮助到大家。


")
")


语音转文字!新媒体翻译者都有哪些实时语音转文本工具?")


