

大家知道excel2013如何制作组合图表吗?如果不知道的话,那就看一看excel2013制作组合图表教程哦,希望大家能够得到帮助。
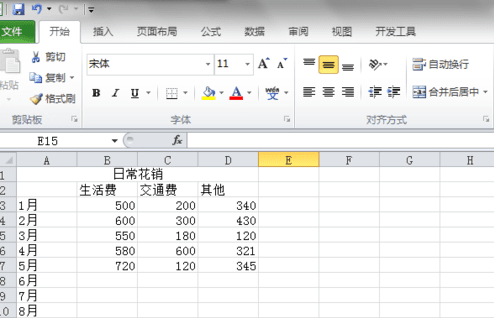
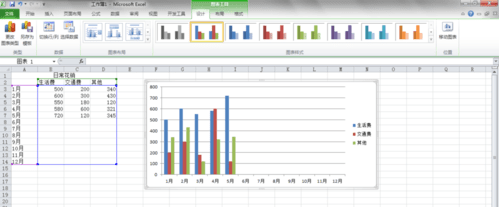
首先制作基础表格,以每月花销举例。
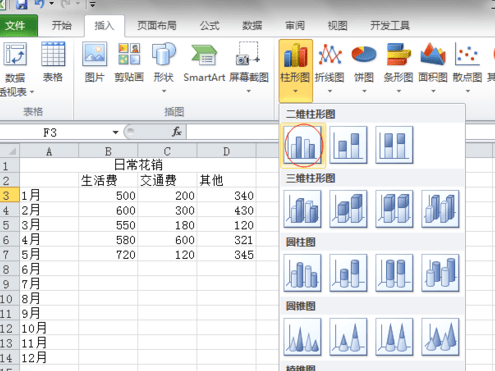
插入图表,并在“设计”下面点击“选择数据”

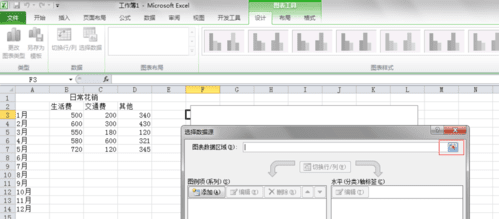
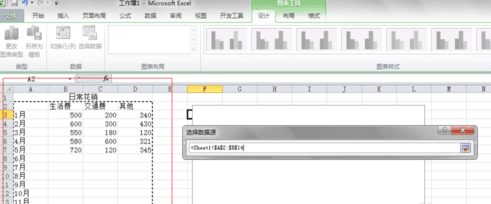
选择“图表数据区域”,选择数据区域,回车,确定,生成图表。
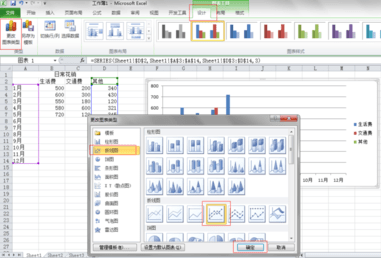
下面将“其他”费用转换为折线图。
1)、选中图表,在菜单栏中“布局”,点击左上角下拉框,选择“其他”;
2)、选择“设计”-“更改图表类型”,选择折线图,确定。

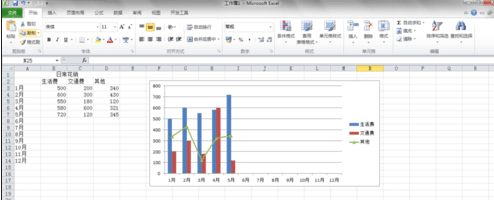
完成。
以上就是excel2013制作组合图表教程,希望可以帮助到大家。


")
")


语音转文字!新媒体翻译者都有哪些实时语音转文本工具?")


