


有的人还不会在excel中画图,下文是小编给大家分享的在excel中画图的具体方法介绍,希望对你们有所帮助哦。
【如何用excel画图】
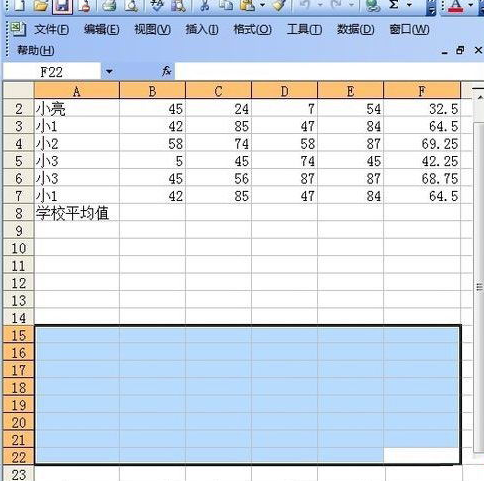
1、首先我们打开要编辑的电子表格 如图;
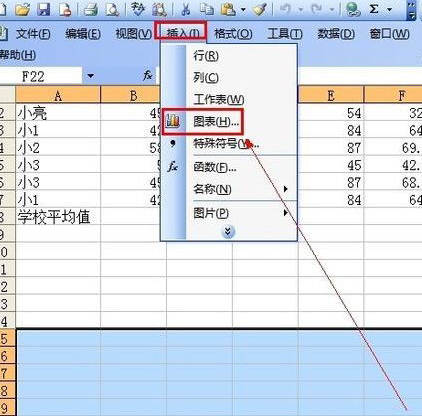
2、在菜单栏里点击“插入”,然后再点击“图表” 如图;
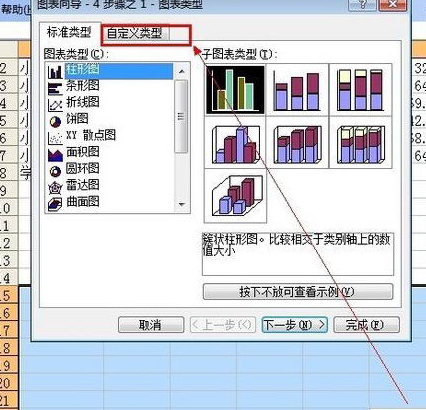
3、在弹出的设置窗口里点击“自定义类型” 如图;
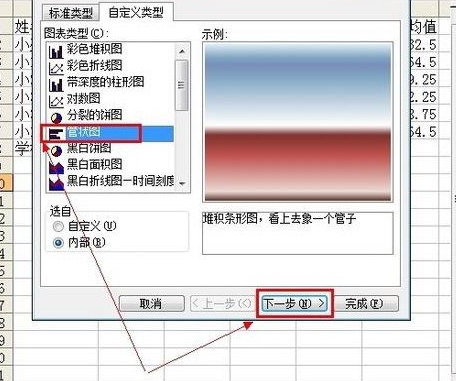
4、点击“管状图”,然后再点击“下一步” 如图;
5、在源数据窗口里的“数据区域”填上你要设置的数据位置,或者鼠标点击进去之后在拖动鼠标圈所要设置的数据位置,然后再“系列产生在”那里打钩列 如图;
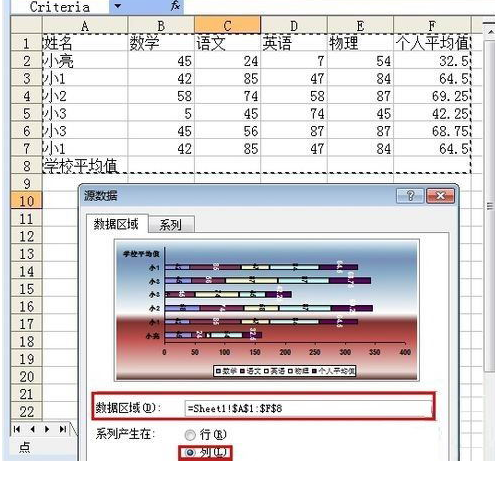
6、完成以上操作之后点击“下一步” 如图;
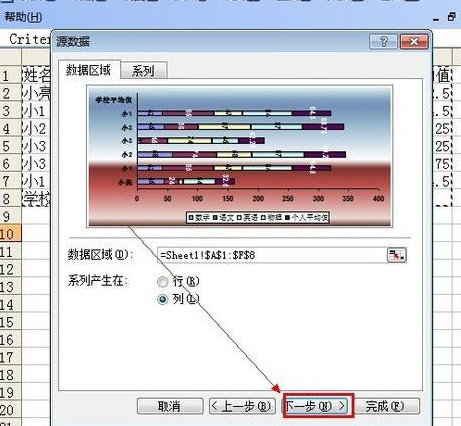
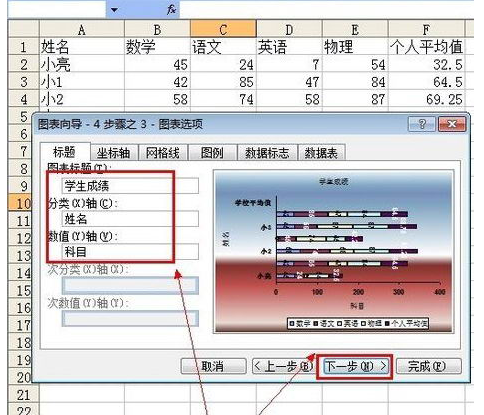
7、如下图所圈位置 填上你要的信息 然后点击“下一步”;
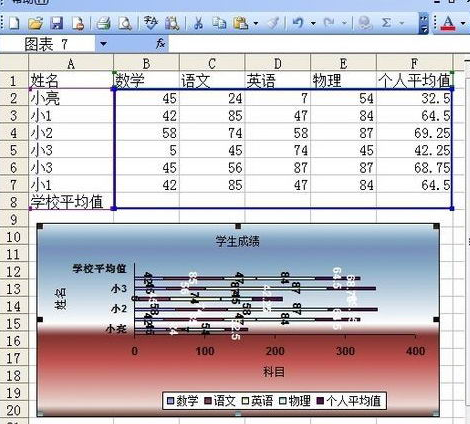
8、完成以上操作之后 就可以做出数据的图表了 如图。
以上就是在excel中画图的具体方法了,大家都学会了吗?


")
")


语音转文字!新媒体翻译者都有哪些实时语音转文本工具?")


