怎么在excel2010图表中设置x轴y轴?下面小编就为大家带来了excel2010图表设置x轴y轴的教程,希望可以帮助到你们。
excel2010设置x轴y轴步骤如下:
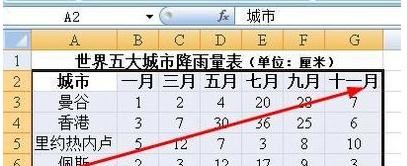
1.以下图的表格为例。如图所示,拖动鼠标选中要建立图标的数据。
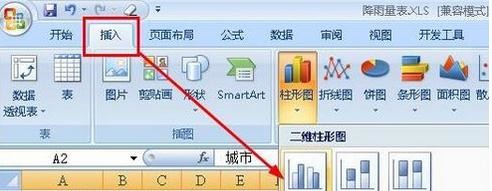
2.点击菜单栏上的:插入--柱形图,选择一种样式。
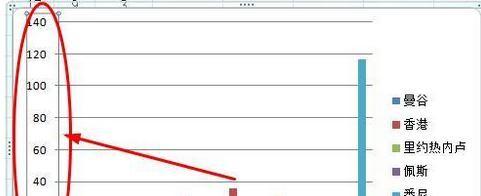
3.在插入的图表上,先点击纵坐标轴选中它,可以看到这个坐标轴四周出现了四个小圆,也叫做控制点。
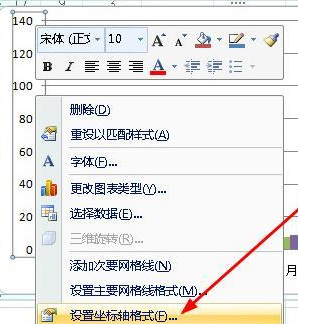
4.右键单击这个坐标轴,然后选择【设置坐标轴格式】。
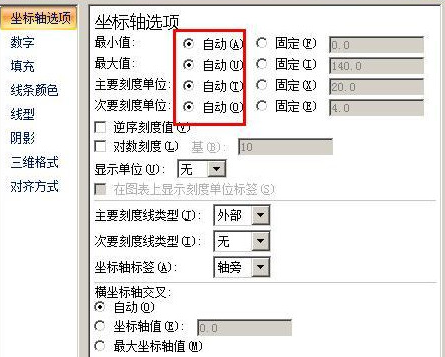
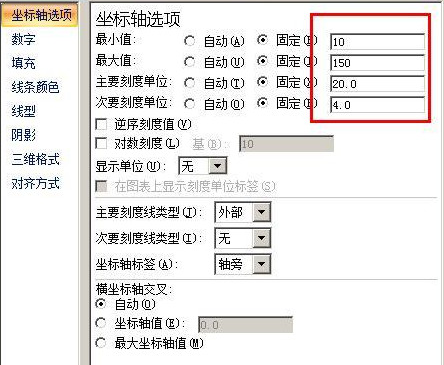
5.在打开的坐标轴格式对话框中,可以看到坐标轴的最大值最小值等都是自动的,为了自己设定,必须先选中固定的,然后设定数值,如图所示。
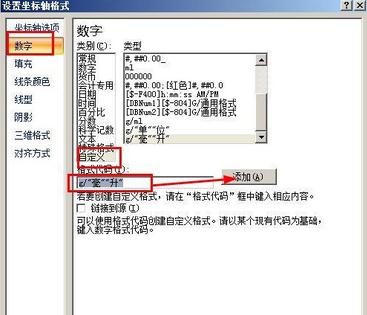
6.设置好刻度以后,点击数字选项,然后在类别下选择【自定义】,在各式代码这一栏输入 g/毫升 ,然后点击添加按钮。这个就是给数据添加一个单位的代码。点击关闭按钮。
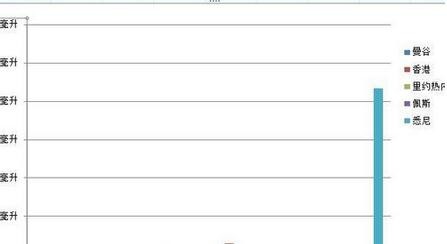
7.完成操作。
以上就是怎么在excel2010图表中设置x轴y轴的全部内容了,大家都学会了吗?


")
")


语音转文字!新媒体翻译者都有哪些实时语音转文本工具?")