


如何在excel中制作组合图表?小编今天给大家带来了在excel中制作组合图表的教程,感兴趣的小伙伴们一起学习一下吧!
excel组合图表制作步骤如下:
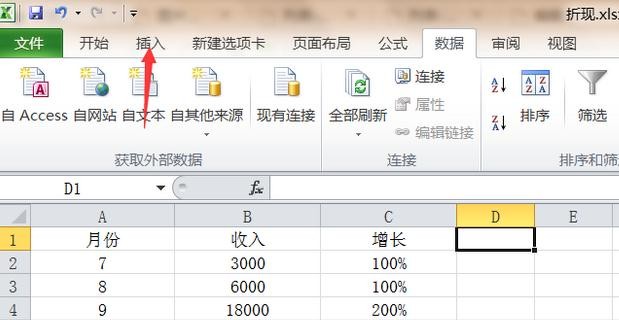
01打开excel,点中一个空的单元格,点击“插入”。
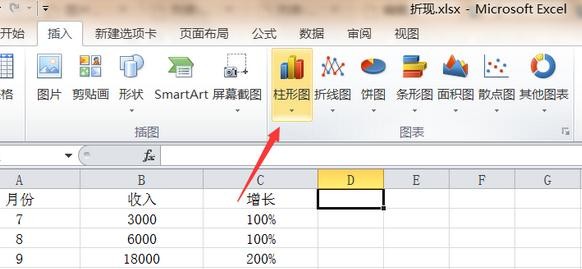
02选择“柱形图”-“二维柱形图”。
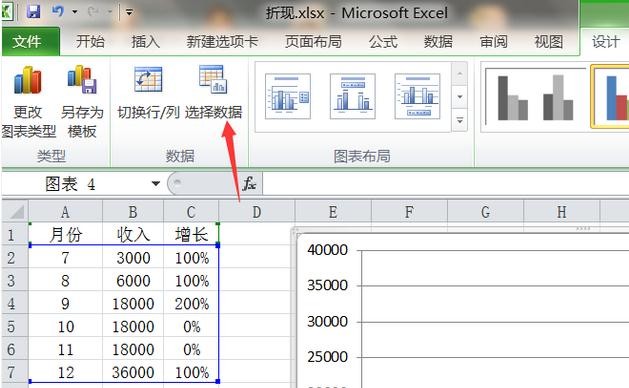
03会出现柱形图。
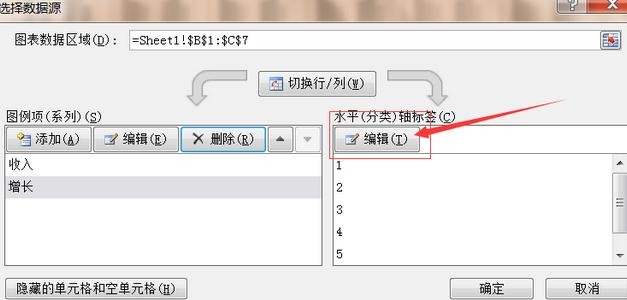
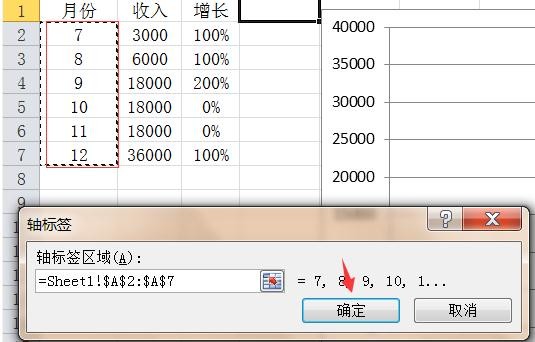
04你会发现出现的柱形图的数据对不上,这时候你要“选择数据”。
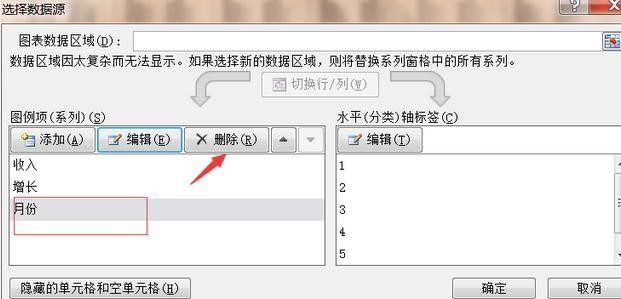
05接着对坐标轴,系列等进行编辑:删除“月份”系列,接着为横坐标选中区域。如图。

06接着选定你想设置为折线图的系列,右键-“设置数据系列格式”。
07选择“次坐标轴”。
08再选定你想设置为折线图的系列,右键-“更改系列图表类型”。
09选择“折线图”。
10这样,柱状图加折线图就做好了。
以上就是如何在excel中制作组合图表的全部内容了,大家都学会了吗?


")
")


语音转文字!新媒体翻译者都有哪些实时语音转文本工具?")


