


你是否知道excel怎样统计数据的个数?今天小编就给大家讲解一下excel统计数据个数教程哦,下面我们就一起去学习学习吧。
方法/步骤
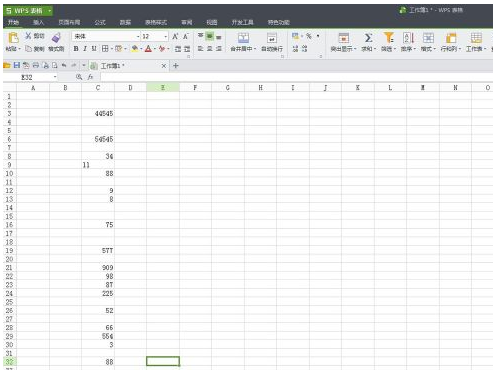
首先将需要处理的数据导入到excel表格中
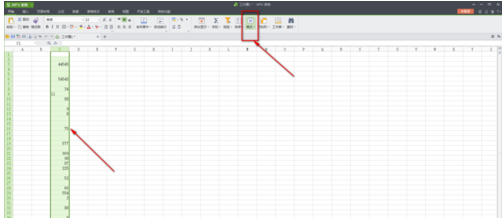
选中待处理的数据,选择excel表格中的“格式”中的“清除格式“
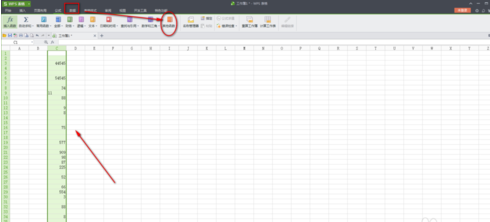
选择“数据”项中的“其他函数”
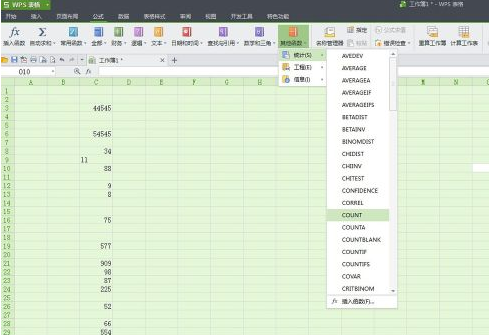
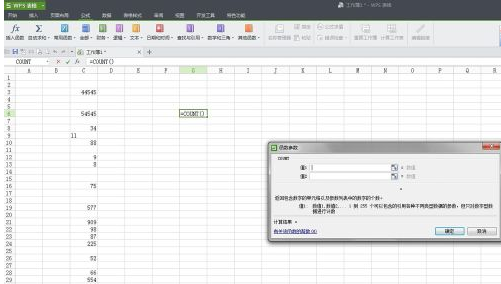
选择“其他函数”中的“统计”项中的“count”函数,会弹出一个对话框,如图
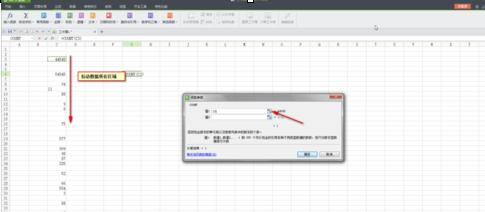
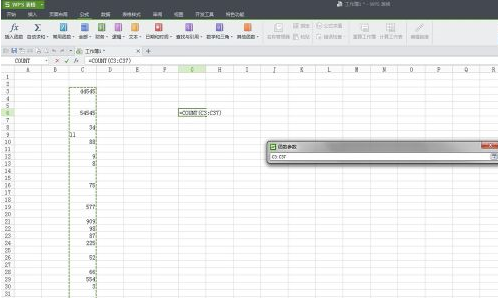
在函数对话框中的范围内下拉数据所在区域就可以了
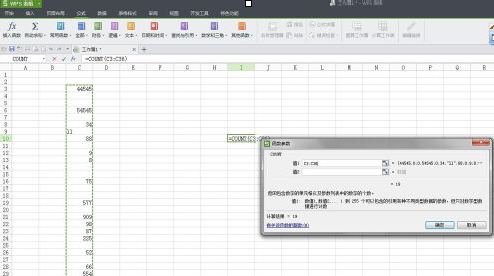
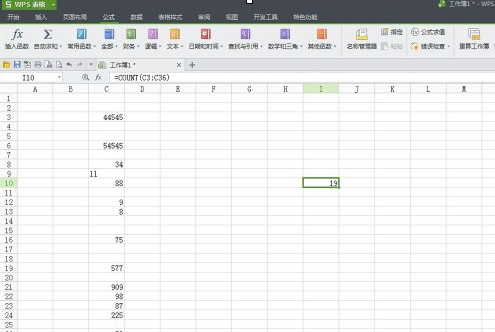
如图所示,在整个excel表格中所选中范围内的数据就统计出来了
以上就是excel统计数据个数教程,希望可以帮助到大家。


")
")


语音转文字!新媒体翻译者都有哪些实时语音转文本工具?")


